


Is a UK Base Rate rise a done deal and if so, what should one do?
At a speech at Lincoln Cathedral 10 days ago, Mark Carney, the Governor of the Bank of England gave a clear hint that interest rates are going up, maybe as soon as the New Year. If one believe the media, it is a certainty, (“a done deal” in City parlance). But is it that simple and what factors are at play in this process?
Although Mr Carney is presumably only speaking for his own voting intention, the voting record of members shows a high degree of consensus, with (unlike the Federal Reserve) no strong and consistent block of dissent, and so his views deserve attention.
The arguments for a rate rise are well rehearsed, as the Guardian notes:
Growth has picked up; wages are finally increasing; business confidence is strong. Moreover, the earlier in the cycle rates start to go up, the argument runs, the more ammunition policy-makers will have to respond to any future crisis. And leaving rate “lift off” too late might allow inflation to take hold, so that the policy response when it came would have to be more drastic.
As David Miles, whose term on the MPC is about to end, put it in a speech last week, “waiting too long to start on a path back to a more sustainable rate is a bad mistake… What you really need to avoid is sharp rises in interest rates.” Miles, who was previously considered a dove, insisted: “The time to start normalisation is soon; that is not something to shrink from”.
The chart below illustrates the market reaction in the Short Sterling Interest Rate Futures market in the days before and after the speech of 16/7/2015 to the present. The 7th July represents the most recent peak in prices (and thus trough in implied interest rates).
|
07-Jul-15 |
15-Jul-15 |
29-Jul-15 |
|||||||
|
2015 |
December |
99.33 |
2015 |
December |
99.23 |
2015 |
December |
99.275 |
|
|
2016 |
March |
99.23 |
2016 |
March |
99.09 |
2016 |
March |
99.145 |
|
|
June |
99.1 |
June |
98.94 |
June |
98.985 |
||||
|
September |
98.95 |
September |
98.77 |
September |
98.815 |
||||
|
December |
98.8 |
December |
98.6 |
December |
98.655 |
||||
|
2017 |
March |
98.67 |
2017 |
March |
98.45 |
2017 |
March |
98.515 |
|
|
June |
98.54 |
June |
98.31 |
June |
98.375 |
||||
|
September |
98.44 |
September |
98.19 |
September |
98.265 |
||||
|
December |
98.34 |
December |
98.03 |
December |
98.165 |
||||
|
2018 |
March |
98.26 |
2018 |
March |
97.98 |
2018 |
March |
98.085 |
|
|
June |
98.18 |
June |
97.89 |
June |
97.995 |
||||
|
September |
98.1 |
September |
97.77 |
September |
97.92 |
||||
|
December |
98.02 |
December |
97.73 |
December |
97.84 |
||||
A few words of explanation may be needed here:
The SS Futures contract is a market estimate of the final LIBOR rate on the settlement date going out to December 2018. The markets’ view can be inferred from the price by the following calculation. It is the best guess on the direction of the BOE Base Rate.
[100-SS Futures price] – 0.13 (the latter discount reflects the fact that this is an Interbank rate and is thus subject to some credit risk relative to dealing directly with the Bank of England).
Example
29/7/15 December 2016 Futures close: 98.655.
The implied interest rate is therefore 100-98.655-0.13=1.215. So, given the current Base Rate of 0.5%, this implies +0.75% over that period.
This means that the market is expecting rate rises of 0.5% (at least) to 1% Base Rate in the next 18 months or so. It is not quite as straightforward as that (there are carrying costs to consider for that 18 month period) but it gives a good approximation of what the market is expecting. Looking out in time we can get an idea of the market’s view on how far (and how fast) rates may rise. It also provides insight into what the market expects the medium/long term consequences will be, as we shall discuss later.
There are, however, a number of counteracting forces arguing for the MPC to remain on hold:
- As the Financial Stability review recently pointed out, UK Households are heavily in debt, and are mostly holding floating rate mortgages, which makes them extremely vulnerable to Base Rate rises. A 0.5% Rate rise would cost a household with an average £150,000 mortgage an extra £38 per month [1]. Many mortgages are much higher than this –as of July 2014, the Resolution Foundation found that 25% of households would be spending more than one third of their post-tax incomes on repayments, and one in 8 would be spending more than half of their incomes with even modest rate rises. This would be deeply unpopular in the country (and therefore presumably also at Number 10 Downing Street).
- Sterling has risen recently, which has put pressure on export competitiveness and increased the “risk ” of deflation by depressing the cost of imports. The economic situation abroad (Greece, China etc.), and the potential US Interest Rate rise (expected in September 2015) also argues for caution. The continuing commitment to “austerity” in the UK, will also act to reduce domestic demand below where it otherwise might be, justifying continued loose monetary policy to off-set this.
- The experience of late 1990’s Japan (and more recently in Sweden) has shown that the risks of tightening early can be just as damaging (not least to Central Banker credibility), as being too late to act. In Japan’s case, in was fiscal tightening, (a VAT rise), in the latter case, monetary tightening that had to be embarrassingly unwound. In Swedish, Interest rates are now below where they were before tightening began (and are now negative).
- But how confident should we be that Mr Carney means exactly what he says? He started his term as Governor (2014) by instituting “Forward Guidance”, specifying in advance the unemployment rate (which he said would be 7%) at which rates would rise. This figure is now 5.4% according to the Office for National Statistics [2] and no rise has occurred. Indeed, the concept of “Forward Guidance” appears to have been abandoned, with former BOE Member Tom Yates saying this has “scuppered the chances of a future MPC using genuine forward guidance as a preventative tool against the next crisis” [3]. At his annual Mansion House speech last year, he warned traders that they were underestimating the likelihood of rate rises. This time last year, the December 2015 contract was trading 100 points lower than today (30/07/2015), so clearly they weren’t!
- There is an increasingly large body of thought that QE is actually causing the very deflation that the BOE is trying to forestall. This article (and others like it), are starting to question its effectiveness as visualised in the chart below. However, Central Banks (and stock markets) are wedded to it and it is hard to see them breaking the cycle by raising rates, and effectively admitting the failure of a policy that has been pursued for the past 8 years. None of the Central Bankers want to be blamed for creating a Japan-like “lost decade”, by raising rates too soon; this is analogous to the situation Rudolf Von Havenstein found himself in 1920’s Germany. As Liaquat Ahamed wrote [4] about the dilemma he faced “Were he to refuse to print the money necessary to finance the {German budget} deficit, he risked causing a sharp rise in interest rates as the government scrambled to borrow from every source. The mass unemployment that would ensue, he believed, would bring on a domestic economic and political crisis“.
- It appears the same mind-set is in operation across the Western world, only this time the instrument of our destruction is a rise in interest rates.
Finally, and most importantly, the market does not seem to believe Mr Carney. Since the speech, the December 2015 contract has risen by 4.5bps (0.045%), the December 2016 by 5.5bps (0.055%) and the December 2017 13.5bps (0.135%). In addition, the difference between December 2015 and 2018 has moved down by 0.06% (i.e. the Yield curve has flattened, normally a signal of impending economic weakness). The market appears to be saying that one or two 0.25% rate hikes are coming in the next 6 months, but that would be more or less it, and any more risks an economic downturn.
What does this mean for EBI Portfolios?
|
Fund Name |
DFA Ultra Short |
Vanguard Global S-T Bond Index |
Vanguard UK S-T Investment Grade Bond |
Vanguard Global Bond Index |
DFA Sterling Inflation Linked Intermediate Duration |
|
|
Number of securities in Fund |
73 |
2014 |
169 |
6424 |
9 |
|
|
Average Maturity, Years |
5.65 |
0.91 |
3 |
5.1 |
8.3 |
10.92 |
|
Average Duration, Years |
4.45 |
0.9 |
2.7 |
2.6 |
6.3 |
9.74 |
|
Average Quality |
AA+ |
AA |
AA- |
A+ |
AA- |
AA+ |
The above shows the bond positions in the EBI Portfolio. If we look at EBI 60, the portfolio has a weighted average duration of 1.78 years. This implies that the bond portion of the portfolio can be expected to fall 1.78% for every one percent rise in interest rates. But this grossly overstates the risk. The 5 funds hold 8689 different bonds, diversified across the world and there is no question of rates going up by 1% across the entire world (the UK-only duration is below 1). Furthermore, with the bond portfolio slightly below target weightings at present, this duration exposure is lower than if the holdings were at the target weights.Finally, the Ultra Short Bond Fund would be able to take advantage of any higher rates almost immediately, thus increasing the yield on this fund. The chart below shows how EBI 60 has done in the past 6 months, together with the bond portfolio.
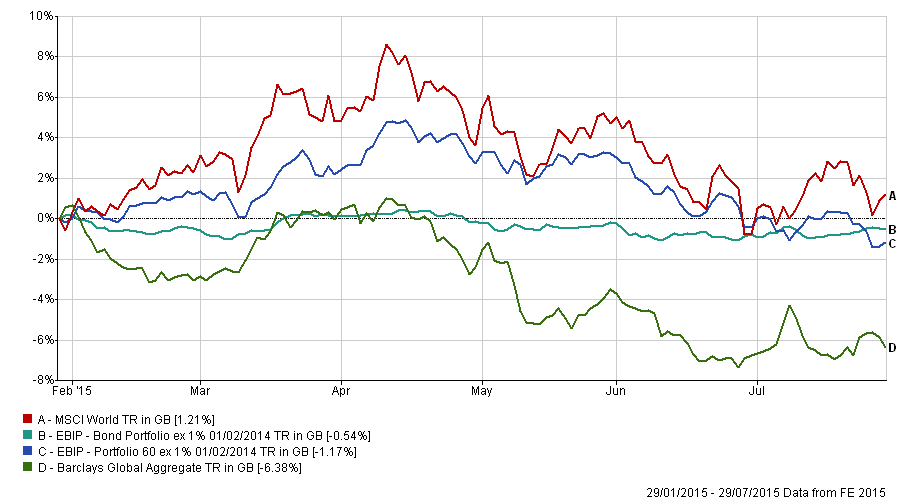
A 60/40 weighting of the MSCI World Index and the Barclays Global Aggregate Bond Index would have returned -1.826%. (+1.21 x 0.6 ) + (-6.38 x 04) = -1.826%. The Bond Portfolio has done even better. Ironically, the source of the weakness has been equities, NOT bonds.
Addendum: The UK is by no means alone in this predicament. The situation is analogous in the US. We may have to re-visit this topic on a more global scale soon.
- [1] This is Money – Mortgate caculator (thisismoney.co.uk)
- [2] ONS – Figures for Feb 2015 (ons.gov.uk)
- [3] longandvariable (https://longandvariable.wordpress.com/2015/07/17/mark-carney-and-the-yield-curve/)
- [4] Lords of Finance: The Bankers Who Broke the World (2009)
Disclaimer
We do not accept any liability for any loss or damage which is incurred from you acting or not acting as a result of reading any of our publications. You acknowledge that you use the information we provide at your own risk.
Our publications do not offer investment advice and nothing in them should be construed as investment advice. Our publications provide information and education for financial advisers who have the relevant expertise to make investment decisions without advice and is not intended for individual investors.
The information we publish has been obtained from or is based on sources that we believe to be accurate and complete. Where the information consists of pricing or performance data, the data contained therein has been obtained from company reports, financial reporting services, periodicals, and other sources believed reliable. Although reasonable care has been taken, we cannot guarantee the accuracy or completeness of any information we publish. Any opinions that we publish may be wrong and may change at any time. You should always carry out your own independent verification of facts and data before making any investment decisions.
The price of shares and investments and the income derived from them can go down as well as up, and investors may not get back the amount they invested.
Past performance is not necessarily a guide to future performance.