


The following blog was produced by Garrett Quigley of GSI (Global Systematic Investors LLP). GSI are the appointed sub-distributor for the Global Sustainable Value fund which EBI will be using in it’s Earth portfolio suite. You may wish to view former EBI blogs on the Value premium both here and here.
Summary
• In global developed equity markets, Growth has outperformed Value for a protracted period.
• Growth is now trading at a historically high price level relative to Value.
• Much of the recent outperformance of Growth vs Value is due to the change in the valuation spread between Growth and Value.
• When Growth last traded at this valuation level, it subsequently underperformed Value for 20 years.
• Over the longest period we can reliably measure in global markets, Value comfortably outperformed Growth, despite a widening valuation spread.
There has been a lot of commentary recently on the fact that value has been underperforming growth[1]. We wrote a piece on this in 2016 when we showed that standard value/growth indices were then indicating that value had underperformed growth over the prior 10-year period by 1.1% p.a.
Here we update this data and introduce some related topics which we will consider over the coming months.
For our returns and characteristics data, we use a well-known source of independent data provided by Style Analytics. Using their analysis tools, we create portfolios based on book-to-market (B/M), which is a standard metric for sorting stocks on value-versus-growth, and then track the returns and characteristics of these simulated portfolios through time. For our purposes here, we create global portfolios where we capture the top 30% (Value) and the bottom 30% (Growth) by market value of stocks when ranked by B/M. We set the country weights in each portfolio to match their market weights in a broad index. We also exclude the bottom 5% of each market to avoid any potential distortions due to micro-cap stocks. All returns are in UK sterling.
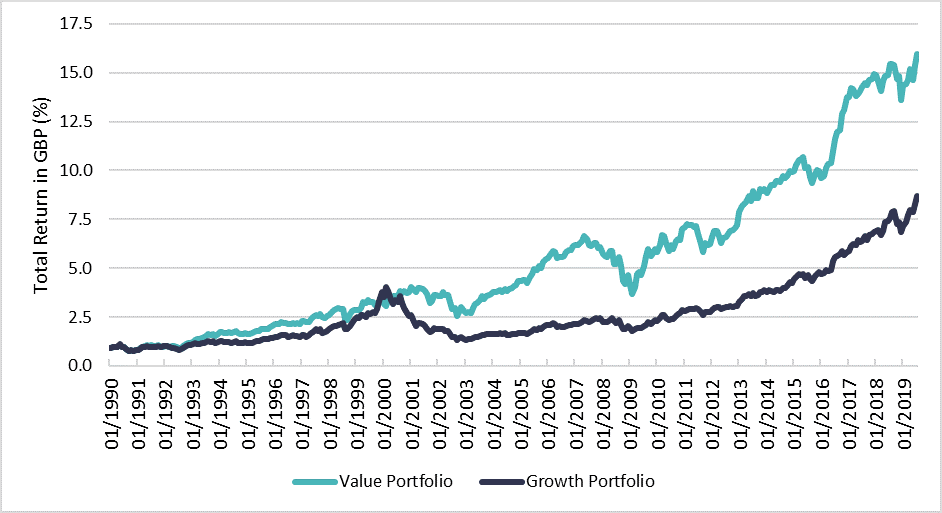
We start the portfolios at the end of 1989 (if we go further back than this, the data coverage declines). A chart of the returns is shown in the figure below.
Total Return of Value and Growth Portfolios since January 1990 (in GBP)
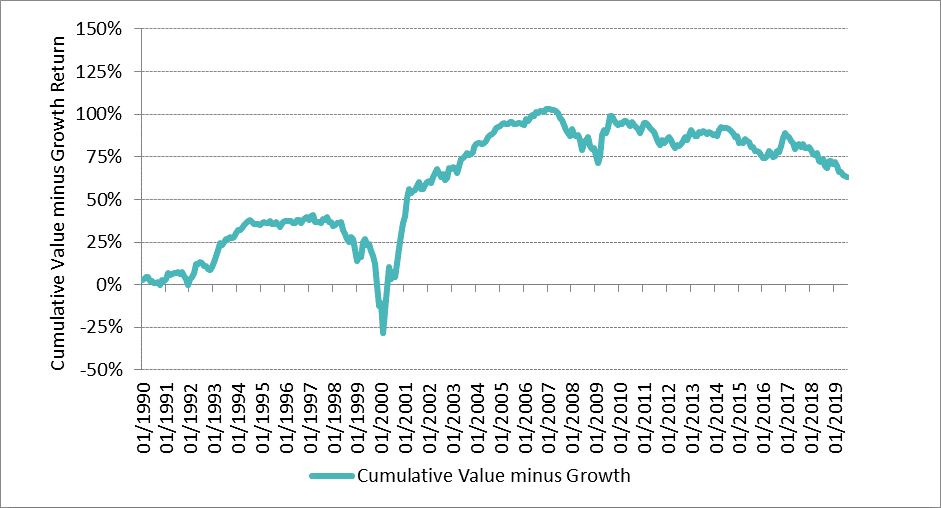
To track the relative returns of Value vs. Growth, each month we subtract the return of the global Growth portfolio from the global Value portfolio, and we cumulate that sum through time as shown in the chart below. As the chart shows, the relative return of Value vs. Growth has been declining recently – i.e. value stocks have been doing relatively worse than growth stocks globally, and this continues a trend that has been apparent for some years. Indeed, the negative trend has continued since we wrote about it in 2016.
The Relative Performance of Value vs. Growth Stock Portfolios
This has caused some commentators to worry about Value as factor in general and others to argue that now is a good time to rotate portfolios towards Value. However, a key issue that is worth considering here is the degree to which the respective ratings of Value and Growth stocks have changed over time. One proxy for this is the Price-to-Book ratio of each portfolio. Price-to-Book or P/B is simply the inverse of B/M but is somewhat more intuitive and is generally preferred as a metric by investors.
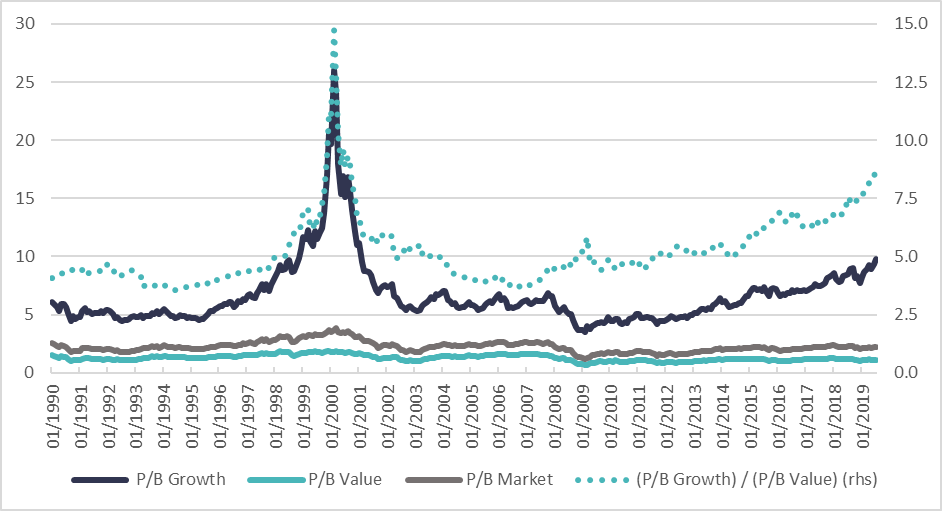
The chart below shows the P/B ratio of the Growth and Value portfolios constructed as above as well as that of the overall market, all as solid lines using the left-hand scale. It is clear from this chart that the P/B ratio of Growth stocks has been trending up since the onset of Quantitative Easing (QE) in early 2009 and is now at 9.8 on a weighted average basis vs. a long run average of 6.67 over the nearly 30-year period covered below. Growth stocks are now trading at a rating similar to that prevailing in late 1999 in the middle of the Tech boom. Of course, Tech stocks are much more profitable now compared to then, but on a P/B basis, they are trading at a historically high level.
Since the onset of QE, Value stocks have not been bid up anything like as much as Growth stocks. In fact, they trade at a P/B of 1.12 compared to their long run average P/B of 1.27, hence at a small discount to that long run average. This change in the rating spread between Growth and Value stocks is shown in the dotted line on the chart below (and maps to the scale on the right-hand side). This dotted line is simply the ratio of the P/B of Growth stocks divided by that of Value stocks. As of the end of July this year, the P/B spread is 8.74 and as the chart shows, it is at a level that looks extremely stretched historically.
Price-to-Book Ratios of Global Value and Growth Portfolios
Some of these ratios are shown over the last 10 and 20 years in the table below. In Panel 1, the P/B ratios are shown for Growth and Value stocks, and the Spread (here shown as the ratio of the P/B of Growth divided by the P/B of Value) is shown on the rightmost column. The changes in P/B are shown in Panel B. For example, over the last 10-year period, the P/B of Growth stocks increased by 131% whereas the P/B of Value stocks increased by only 23%. The annualised change in the P/B ratios is shown on the right of Panel 2. So over 10-years, the Growth stock portfolio experienced an annualised uplift in its P/B ratio of 8.7% p.a. compared to just 2.1% for Value stocks.
From Panel 3, we can infer the effect of the P/B changes on returns. Over the last 10 years, Growth stocks had a total return of 325%, equivalent to 15.6% p.a. and Value stocks returned 213%, or 12.1% p.a., a difference of 3.5% p.a. in favour of Growth stocks. However, as we saw in Panel 2, Growth stocks have also been substantially rerated – at least insofar as their P/B ratios have been pushed higher indicating high future return expectations.
On the right of panel 3, we show the effect of deducting the rating change from the return of Growth and Value portfolios over 10- and 20-year periods. For example, the 15.6% return for Growth stocks over the last 10 years is reduced to 6.8% after adjusting for the 8.7% p.a. rating change etc. Value stocks on the other hand had a smaller uplift in their P/B level of just 2.1% p.a. so when this deducted from the 10-year Value return the adjusted return is 10%, which is 3.2% higher than the adjusted Growth return.
Seen this way, the performance of Value stocks looks rather better. A 12.1% p.a. return over 10 years is already very impressive. But the main reason that Growth stocks have performed better over 10 years is because they have been pushed up to a much higher level of P/B ratio. Even we if adjusted for only half of this rating difference, the adjusted return of Value and Growth stocks would be very similar.

Of course, this is a rather crude rating adjustment and there are other metrics that one might consider and well as the current and expected levels of profitability of Growth vs. Value stocks. The broader point is that Growth stocks may have done relatively well over a sustained period, and this has occurred once before in the last 30-year period. However, the last time Growth stocks traded at this high a level was in late 1999. We can see from the top chart and Panel 3 of the table that over the 20-year period since mid-1999, when the P/B spread was at 6.4, less than it is now, Growth stocks underperformed value stocks by 2.1% p.a. This was in spite of the fact that over the 20-year period, Value stocks were pulled down by a greater decrease in their P/B level.
It is unwise to think that markets will repeat these patterns in a simple way, especially since we are in unusual times with $15 trillion of government and corporate debt across the world exhibiting negative yields. However, it is equally unwise to be influenced too much by recent relative performance. Doing so would have led to very poor asset allocations historically and the simple fact remains that valuation still serves as a useful, if imperfect, guide to long-run expected returns.
IMPORTANT INFORMATION
This document is issued by Global Systematic Investors LLP (“GSI”) and does not constitute or form part of any offer or invitation to buy or sell shares. It should be read in conjunction with the Fund’s Prospectus. GSI is authorised and regulated by the Financial Conduct Authority. The company’s registered office is 75 King William Street, London, EC4N 7BE.
The price of shares and income from them can go down as well as up and past performance is not a guide to future performance. Investors may not get back the full amount originally invested. A comprehensive list of risk factors is detailed in the Prospectus and an investment should not be contemplated until the risks are fully considered. The Prospectus can be viewed at www.gemini-im.com.
The contents of this document are based upon sources of information believed to be reliable. GSI has taken reasonable care to ensure the information stated is accurate. However, GSI make no representation, guarantee or warranty that it is wholly accurate and complete.
The GSI Global Developed Value Fund (“the Fund”) is a Sub-Fund of GemCap Investment Funds (Ireland) plc, an umbrella type open-ended investment company with variable capital, incorporated on 1 June 2010 with limited liability under the laws of Ireland with segregated liability between Funds.
The Company is authorised in Ireland by the Central Bank of Ireland pursuant to the European Communities (Undertakings for Collective Investment in Transferable Securities) Regulations 2003 (S.I. No. 211 of 2003) (the “UCITS Regulations”), as amended.
Gemini Investment Management Ltd is the appointed Global Distributor and is responsible for the oversight of all distribution arrangements for the sub-fund. GSI are the appointed sub-distributor for the fund.
________________________________________
[1] Some recent comments on this point are: https://www.evidenceinvestor.com/is-the-value-premium-dead/, https://www.advisorperspectives.com/articles/2018/05/11/dont-give-up-on-the-value-factor, https://citywire.co.uk/new-model-adviser/news/us-equities-what-next-for-growth-versus-value/a1006479
