


“Men, it has been well said, think in herds; it will be seen that they go mad in herds, while they only recover their senses slowly, one by one… Truth, when discovered, comes upon most of us like an intruder, and meets the intruder’s welcome… Nations, like individuals, cannot become desperate gamblers with impunity”
Charles MacKay, Extraordinary Popular Delusions and The Madness of Crowds, 1841
Since the victory of Donald Trump, (equity) markets have been on a tear: there appears to be nothing to stop them, as optimism abounds. But there are some strange reminders of a past era, one that didn’t end well for Investors. Will history repeat – does it have to?
The following two charts show the growth in Credit Card and Sub-Prime Auto debts, which have spiked in the last Quarter, (though in truth, they have been strong for a number of years). Both are signals of optimism – after all, one doesn’t normally take on debt unless one is confident it can be re-paid. This aligns well with recent sentiment indicators which suggest strong positive sentiment almost across the board.
.png)
.png)
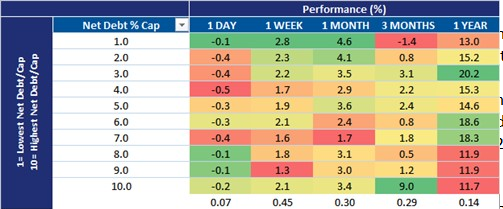
How has it all played out for Investors? A bit of a mixed bag actually. Below shows the Quarterly breakdown for investment “styles”, which highlighted the persistent out-performance of Value versus Growth, the volatility of returns to Momentum, and the shift towards ever-larger cap shares. Note in the second chart the huge out-performance by indebted Companies in the last 3 months – is this the notorious “dash for trash” in action?
.png)
The Global factors (see chart below), also showed the lagging of Min Vol/Momentum; the former is defensive in nature, so is not a huge shock, but Momentum has also lagged, which is surprising. The explanation may lie in the extremely “crowded” nature of these “styles” – (see here for how this normally ends). Stories (like this one) make it seem like a market that is easy to navigate but, while the Minimum Volatility thesis was all too easy to buy into, it is now lagging. This is possibly down to the weight of too much popularity – anyone who wants the protection of Min Vol strategies has already bought it; who therefore is left to do the buying?
.png)
So, we are left with a quandary – is this a sign of a bubble that will inevitably burst or is it the market re-pricing an almost entirely new scenario, one that the markets had not expected at all? There are signs of excessive borrowing, and the return of newspaper articles suggesting that amateur fund managers can do the job of investment professionals (whatever your view of their ostensible merits) is another sign of widespread (over-) optimism. On the other hand, markets can (and must) react to news, especially that which challenges prevailing assumptions[1]. It is also true that the mass participation which characterised the late 1990’s and 2005-07 is most definitely NOT present (at least not yet).
The most likely answer is that we are seeing a change in the market’s perception. The rise of Value and the relative under-performance of Growth and Momentum points to confusion, not certainty, in a world where the game may have changed. What to do? Very little. Factors/Styles wax and wane with no regularity and no predictability. If the bubble is here, diversification will reduce the scope of losses and if not, broaden the scope of gains. It is worth remembering that both the 2000-03 and the 2007-09 crises led to a c.50% decline in the Dow Jones Index, but a 60/40 Equity/Bond portfolio lost only around 35% during the same period. Not great, but a lot easier to cope with and thus less stressful – this in turn, reduces the perceived need to do something about it, which is when errors are made.
As time passes, it will all be resolved one way or the other, but trying to second guess markets (as 2016 has demonstrated all too clearly) is even more dangerous. As it happens, we are close to a rebalance on our EBI Vantage Funds from equities to bonds, rather than the other way around, in order to maintain the asset balance- to do otherwise, especially when Trump hasn’t even taken office, let alone done anything, would be speculation rather than investing. We’ve all seen enough of that to know how expensive that can be.
[1] To take an extreme (and highly stylised) example, on the 8th November, prior to the election result, the Dow Jones closed at 18380. Possibly, embedded in this price was the market’s view that there was a 10% chance of Trump victory (this was very much a minority view), a 30% of the market moving up to 19667 (which represents a 7% gain, the long run annual US equity return) and the majority of hard-bitten cynics, 60%, saw no change as a result of the election.
Adding those probability together- 14000 x 10% + 19667 x 30% + 18380 x 60% gets an expected Index level of 18328. To get to 19900 (roughly where we are now on the Index), implies that market expectations have changed significantly: we can arrive at 19900 by assuming a 35% chance of 20,000, a 25% chance of 22750, a 35% chance of the Index going back to 18380, and a 5% chance of 14000 being the Dow end point. So, a change in the assigned likelihood of the Index moving to a different level can lead to a large change in pricing. None of this is precise, but then neither are markets themselves.
In fact, Index Option prices can give an even more accurate steer on market implied probabilities, but that is beyond the scope of this post.
