


“Bankers are just like everybody else – except richer. Ogden Nash (US Poet 1902-71).
(This post is going to be a little formula heavy. Sorry, I shall return to my usual inanity next week).
Since 2009 Central Bankers (via QE etc.) have created a situation whereby all asset prices now have more or less the same expected long-term returns, such that Investors are now indifferent between them. So, Investors have (as was intended), been forced to look for alternative strategies to improve their return outlook. Two such strategies have emerged: the “reach for yield”, namely the buying of High Yield equities on the one hand, whilst others have focused on “Value”, to wit, the purchase of assets that are relatively cheap compared to their respective alternatives. Both contain some assumption flaws, which we will look at in turn.
1) Investing for Income: we have discussed this issue before; the strategy rests on some major assumptions;
– The first is that capital losses are not likely. Only if we exclude the possibility of losses can we count on a 2%, 3% etc. yield to generate return. Stocks (indeed, all assets) are priced on the long term stream of cash flows that they generate (both positive AND negative) – extra yield today may well come at the expense of capital return tomorrow.
– The second is that one can expect yields to continue indefinitely; I have mentioned the Sustainable Growth formula before; what it tells us emphatically is that there is no free lunch. Increased income means lower growth (and thus returns) tomorrow.
SG = ROE (Return on Equity) x (1- dividend pay-out ratio).
Assume a Company with a ROE OF 10%. (Net income is £1 on Shareholders Equity of £10). A pay-out ratio of 50%, implies a SG rate of 5% (and a dividend of 50p). Increasing the pay-out ratio to 60% will lower SG to 4% (0.1-0.6 = 0.4). To generate the same absolute dividend pay-out the following year, (assuming the pay-out ratio remains constant), the ROE must continually rise (which in turn assumes future projects will be more profitable than thus far). Constantly increasing profitability is an unrealistic scenario, as new entrants to that Sector/Industry would tend to compete the excess returns away. Thus, the firm is in a no-win situation, it needs to grow faster and faster to keep up with Income expectations, but if their sector is profitable enough to match them, the likelihood increases of more competitors, which depresses profitability. Even a slow-down in growth rate of the sector (let alone a generalised economic slowdown), will turn a virtuous circle vicious in short order. It is logically impossible for investors to profit from this strategy in aggregate (and in the long term). There are signs that the crowded Income Sector is starting to stagger under the weight of popularity – the IA Equity Income sector has unperformed the FTSE All Share Index by 3.25 percentage points in the past year, and by about the same over the past 6 months.
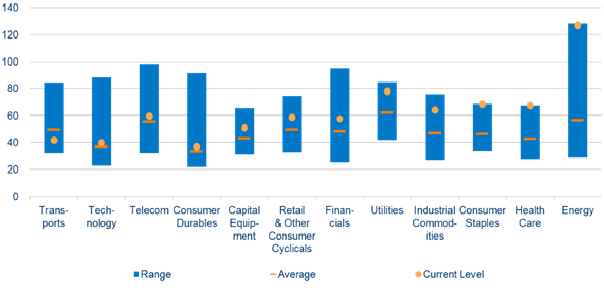
Below, from Empirical Research Partners (via Schroders), shows the Developed Markets (ex-US) pay-out ratios by sector. Energy, Consumer Staples and Healthcare ratios are at their highs; taking the Consumer Staples as an example – to get back to the c.45% pay-out ratio, earnings would have to rise 44% (or a 5-year compound annual rate of 7.56% p.a.). This is possible, but not something to take on trust.
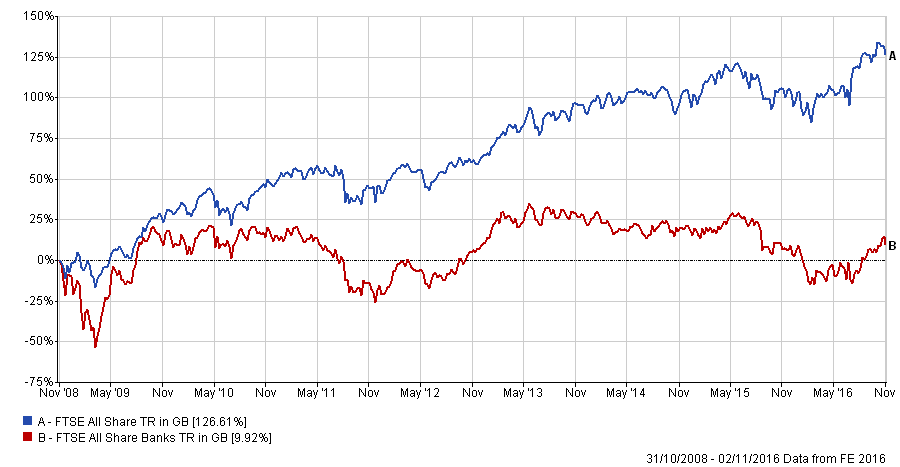
2) Value Investing: a lot of this is focused on Banks (see here for example). Despite (or maybe because of) the sustained underperformance (see below) of the UK banks, investors seem to be warming to them, as they seem to offer relative value, compared to what many investors feel are generally over-priced stocks. In the last 6 months they have rallied, such that they have beaten the FTSE All Share Index by 5.65 percentage points (+16.34% versus +10.69% for the latter).
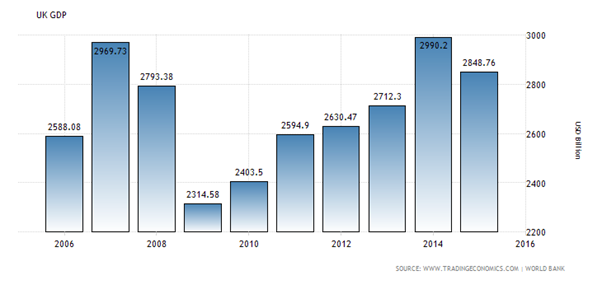
But do they represent value? In order to evaluate this claim, we need to dig slightly deeper and go back to 2008 to look at the costs of the crisis for the UK. Above is a chart of UK GDP since 2006, (I have used $1.40 as an average to convert to £). If one assumes a 3% p.a. reduction in GDP since 2008, the total cost to the UK economy has been £470 billion in lost output[1]. Assuming a once in 40-year frequency of these events, one can calculate the risk-adjusted level for the levy [2]. Next, we need to calculate the Net Present Value of this huge sum, and for this we need to use the Gordon Growth Model (GGM).
The formula is P = D/(k-g) , where P = Future Value of the Levy, D = Current levy value k = Equity Premium, g = growth of the levy.
Plugging the numbers into the formula, we get :
11.75/(0.06-0.02) = £294 billion.
This is a HUGE number; more importantly, as per the Hargreaves Lansdown website (02/11/16), the market capitalisation of the top 5 UK Banks is currently £250 billion[3]. Of course, there are a lot of assumptions embedded therein, and the likelihood of a re-introduction of the levy is probably low, but this calculation suggests that most (if not all) of the value of the company’s equity would be wiped out in that event, and that were in not for the fact that the social costs of the sector’s activity – the risk of another crisis – is paid for by the state (i.e. us!). Were that to cease to be the case, (and US regulators have again recently warned on this issue, with UK regulators seemingly similarly disposed), banks may have little or no equity value! Perhaps they are attempting to price in the risk of nationalisation, (which may be only one crisis away); as Mr Mervyn King, former BOE Governor once said “it is hard to see why institutions whose failure cannot be contemplated should be in the private sector in the first place.” If so, they are cheap for a (potential) reason.
[1] To arrive at this , divide the total GDP for the year by 97, multiply by 100, and subtract the difference.
[2] 1/40 = 0.025. Therefore, the levy should be 0.025 x 470 billion = £11.75 billion. In fact, it was lower than that, and has since been abolished, but the point still stands.
I am assuming an expected rate of return on equity (k) of 6%, and that GDP growth (and thus the growth rate of the levy) will be 2% going forward (r). This may sound conservative, but a higher rate would increase the NPV of the levy.
[3] There are other banks which could be added to the total market cap figure (the Post Office, Tesco Bank etc.), but they represent a tiny fraction of the “Big 5”. For completeness, I have added another £15 billion to the total to get to £250 billion.
