


“You can’t cheat an honest man” – 1939 Film by W. C. Fields.
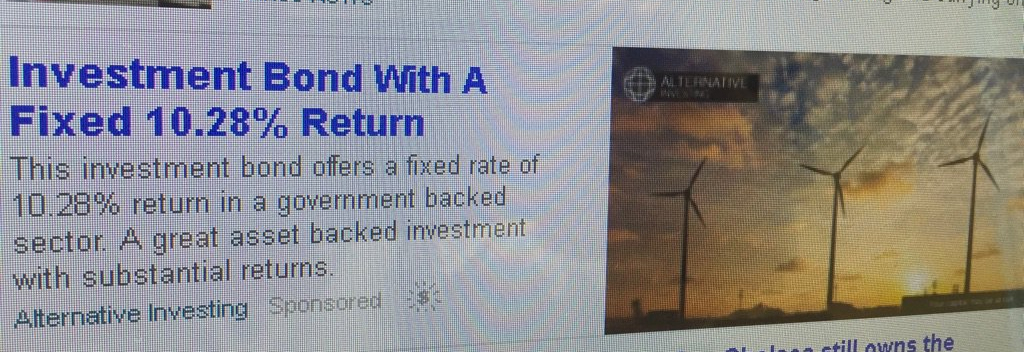
We live in a low return world. As Interest rates fall, the pressure is on to find investment returns to which we have become accustomed over the past 20 years or so. I thought of this when I saw this advert on Twitter this week. Then a client e-mailed this brochure, accompanied by an implication (from the company), that one could achieve a 7% annual withdrawal rate using this product. We have numerous articles on “Sequence Risk” on our Repository (here, and here for example), and most academic evidence suggests that 4% per annum is the maximum sustainable rate of withdrawal, unless of course one is prepared for the risk of running out of money!
What both of these “products” have in common is that they aim to capitalise on the human tendency to indulge in self-delusion and wishful thinking. There is a perennial human instinct to believe things that are just not true (or likely), such as Arsenal winning the Premier League, or beer being good for you (guilty on the latter one). Hence Investors are easily persuaded that risk and return can be disconnected, and that it is possible to have all the up-side and none of the risk in an investment strategy – the rise of “Smart Beta”, and the intense interest in Low Volatility strategies are a case in point). Safe Assets pay low returns; higher returns require more risk. Above market returns are not possible without taking above market risk. [Repeat as many times as necessary]
Let us look at the “Investment”.
The fact sheet, states that it has an Indicative Yield of 4% (which is the same as that of the MSCI World High Dividend Yield Index. The MSCI World Index has a yield of 2.65%; thus the High Dividend Index yield is 1.5x higher, and is thus proportionately riskier). The inception date of the fund is 1/5/16, which means that the fund has an extremely short track record, and is based on data from the past, (which may or may not have been appropriately mined), The top ten holdings represent 85% of the fund’s assets and are exclusively “Dividend ” or “Income” funds, which seems pretty concentrated. According to the Product Summary the fund “will invest in a wide range of asset classes combined in a way to meet risk objectives whilst delivering a reasonable level of yield rather than focusing on capital preservation”. Thus, the fund is assuming price risk to gain Income – the investment universe is considerably narrowed by focussing on Income rather than total return. In such a way, risk is not reduced, but transformed (to paraphrase Einstein).
What is this risk? The Sustainable Growth Rate formula, shows that the larger the dividend payout, the lower the amount of investment capital available to re-invest in profitable new ventures [1]. At some point, the company runs out of investment funds, which depresses the growth rate, thus lowering the dividend payout. It is therefore an example of eating one’s seed corn; it is not a sustainable long term investment strategy, and ultimately leads to the company going “ex-growth” (and soon ex-income).
What is the likelihood of being able to make 7% annual returns, to allow that sort of withdrawal rate? A recent (conveniently timed) article suggests that in the US an Investor now needs to take 3 times the risk (as measured by Standard Deviation) compared to 1995 to achieve the same 7.5% annual return. The table below shows the long term picture from a UK Investor’s perspective – it looks similarly bleak.
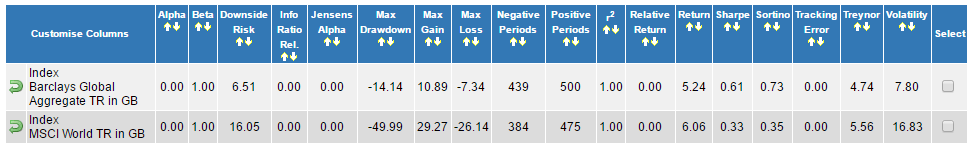
Let us start from the assumption that a client is invested 60:40 in Equities and Bonds: the two Indices above represent a Global proxy for the equity markets (MSCI) and the Bond market (Barclays Global Aggregate). Using above data, we can calculate an annualised return of 5.73% per annum annualised for a 60/40 portfolio (6.06 x 60% + 5.24 x 40% = 5.74%). The weighted average standard deviation of the portfolio is going to be circa 13% (or a little less due to low correlation of these two asset classes) on an annualised basis. (60% x 16.83 + 40% x 7.8 = 13.22%). We have 20 years of data, and we need to know the Standard Error, to correct for the (relatively) small sample size, thus neutralising the possibility of “sampling error”. [2]
So, we now have a range of possible returns of 5.92% (2 x 2.96), which is greater than the annualised return figure. The range of likely (95% probable) returns is thus -0.19% / +11.66%, which is a huge range. (The former suggests we should not buy any equities, the latter that we should own as much as we can!).
How likely is a 7% return? This chart [3] enables one to see that a 7%+ return is a 0.22 Standard Deviation event, which is a 41% probability, slightly worse than tossing a coin. Ceteris Paribus, the higher the equity content of the portfolio, the higher the risk of an unpleasant outcome.
But this assumes that past is prologue – Bill Gross, a major bond market manager cautioned against thinking this way yesterday – how confident can we be that (for example) Central Banks will continue to step in whenever markets experience times of “stress”? They may lack the political will to do so (see here), or it may just not be financially possible to do so in a large market context (i.e. government bonds) . Investors may thus be taking on more “political” risk than they realise (the seeming impotence of the Bank of Japan to end a near 30 year bear market in Japanese equities gives us a glimpse of the possible future, and via Sequencing Risk shows the damage a high withdrawal rate, combined with a bear market will do to investors).
What conclusions are to be drawn?
1) There is no such thing as a free lunch. To achieve greater returns, investors MUST take higher risk; be wary of any investment firm that tells you otherwise, because they are trying to sell you something.
2) History tells us surprisingly little. That markets HAVE recovered from war/depression etc. is no guarantee that they will do so again: this would be an induction error, (which turkeys are prone to commit in Decembers). Thus, the amount we can safely withdraw/spend etc. is highly dependent on questions to which we cannot give high confidence answers. It is therefore important to remain aware of the appeal to emotions, illogic and various other human traits by product providers, as a way of relieving us (and our clients) of cash.
3) At EBI, we see our role (amongst other things) as a sense check against the siren call of the salesman. The City has made (not earned) a good living by selling clients what the latter can be persuaded they need. Some are merely expensive, some are solutions in search of a problem, and others are downright dangerous – trying to put investors into “no-risk/low-risk” investments falls in the latter category; there is always risk, and it does investors no service to pretend otherwise.
[1] Consider a Company with an ROE (Return on Equity) of 10% and a pay-out ratio of 50% (i.e. the company pays out 50% of its earnings in dividends). The Sustainable Growth Rate is therefore 10% x (1-0.5)= 5% p.a. If the payout ratio goes up to 60%, the SGR is 4%-10% x (1-0.6)= 4% etc. etc.
[2] The Standard Error of a sample is equal to the square root of the number of years of data (thus it is the square root of 20 which is 4.47). The Volatility (13.22) divided by 4.47 = 2.96. To get a 95% confidence interval (2 standard deviations in the jargon), we need to multiply 2.96 by 2 (5.92).
[3] 7% is 1.22 x the 5.73% annualised return figure. Move the mouse on the chart such that Z= 0.22. You get 8.71, which when added to 50% (the left hand side of the chart) gets to 58.71%. Thus anything at or to the right of that represents a 7%+ return, which is 41.29%.
