


This is an example of a report I was asked to prepare for a client who was interested in the oil market. It was written on the 27th March 2015 when the oil price was less than $50 per barrel. Post this report, the oil price rose relentlessly, reaching $64 within a month. It clearly demonstrates the limits of using “fundamental analysis” to gauge future market movements. The fact that it was almost completely wrong, despite the wealth of data to support it, reminds one that trying to foretell markets’ behaviour is a fool’s errand. Markets are designed to wrong-foot the majority, and so it is much more sensible to just take what the market gives you. That is what Index Investing is all about.
The Oil Market: How to Profit from Price Moves
There are several ways to gain exposure to a rise in oil prices:
- Buy low cost oil producers
- Buy oil service companies
- Sell transport stocks
- Buy oil/energy ETFs
The most direct way to do so would probably be the last. Please see attached price performance charts.
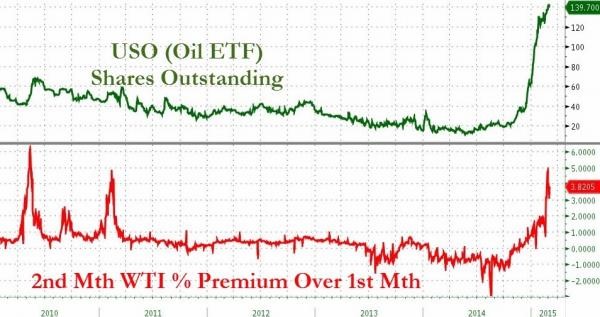
The oil market has been in the news for months as the price has more than halved since June 2014. After such a steep decline, there have been some interest in getting back into the market, as can be seen by the flow of funds into USO (the American oil ETF):
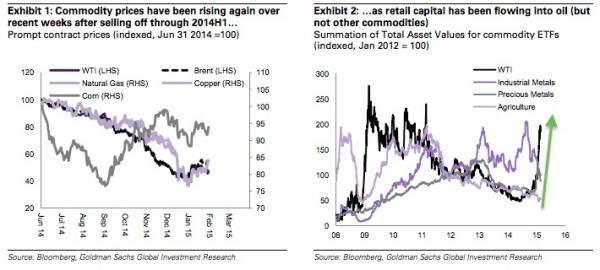
This is occurring at the same time as fundamentals appear to be weakening:
We believe that these inflows are generating selling opportunities in oil and copper precisely because they are at odds with commodity market fundamentals. As we have previously outlined, even with the rapid fall in the US rig count over recent weeks, rising rig productivity, the backlog of wells and the possibility of high-grading in the near future, means that US production growth has not yet slowed enough to balance the oil market. The record US oil inventory builds seen over the last few weeks support this view, with US Gulf Cost (PADD 3) stocks now at 220 mil bbl., the highest level on record. Furthermore, we expect inventory builds to both continue over 2015H1 and to spread globally (OECD ex. US inventories have been drawing recently), as China’s oil import demand remains weak…
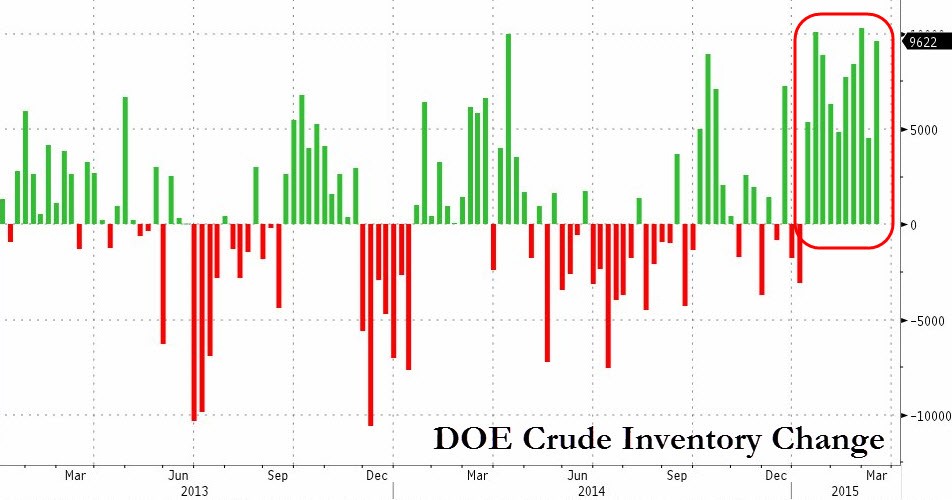
This can be seen most clearly in the Inventory build recorded by the US DOE (Dept. of Energy), and from Bloomberg:
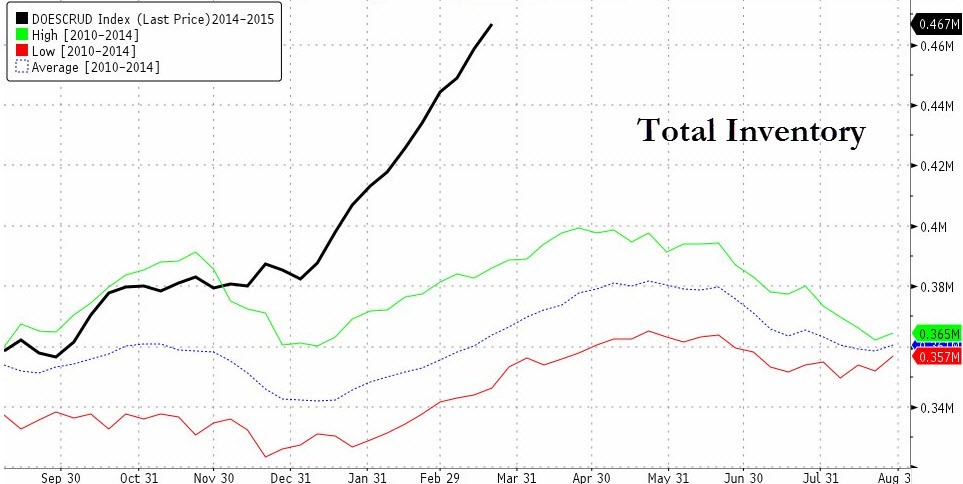
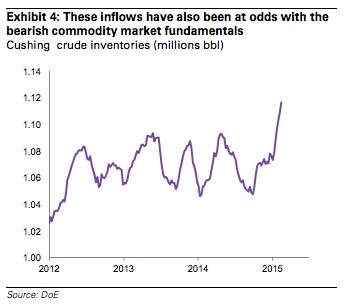
This level of build must at some point come onto the market. The WTI storage centre (Cushing, Oklahoma) is now 70% full. Once it is full, producers will have no option but to sell in the open market for whatever they can get…
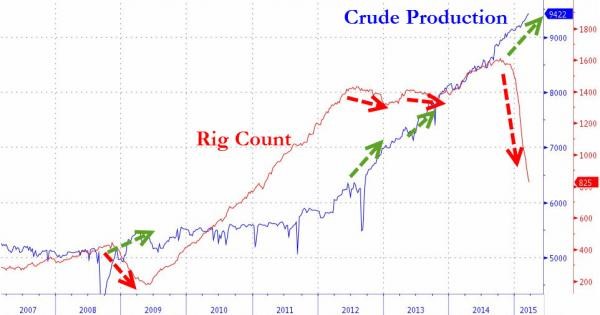
There has also been much talk about the decline in Rig Count (the number of oil rigs working). But as the next chart implies, the reduction has mainly been concentrated in low productivity wells. Actual production is still rising as the more efficient wells continue to pump:
The ETF Market
The next area of concern is the ETF Market itself. For this we need a quick refresher on the sources of return for commodity ETFs.
But it’s important to remember that most ETFs don’t invest in commodities directly (though some precious metals ETFs do). Instead, they buy commodity futures contracts that have three sources of return.
The return on a commodity futures contract is the sum of: change in spot price + roll yield + collateral yield. Excess return indices include the first two types of return, but only total return commodity indices include the third source (collateral yield).”
“When a futures market is in contango, the price of the commodity for future delivery is higher than the spot price (longer-dated futures prices are higher than near-dated futures). A chart plotting the price of futures contracts over time is upward-sloping.
When a futures market is in backwardation, the opposite occurs (far-dated futures are lower than the spot or near-term futures price). A chart plotting the price of futures contracts over time is downward-sloping.
To recap, an investor buying a commodity futures tracker must reinvest continually from expiring nearer-dated contracts into further-from-expiry longer-dated contracts.
The larger the premium on the next month futures contract, the bigger the loss (and the lower the return) on the ETF long position when the contract expires. The reverse applies of course, for the ETF that is trading from the short side, since they are getting a premium over and above the current futures price. Thus, the next chart shows an odd divergence. As the premium expands, one would expect to see the number of ETF shares outstanding dropping (as the profit from the roll spread falls, thereby discouraging ETF buying of oil).
Potential for Demand to rise
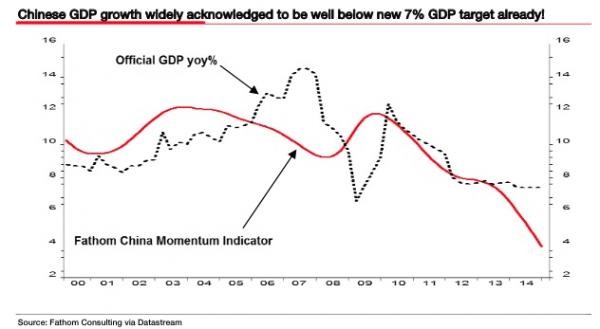
What about China? It has long been touted as the world’s growth saviour, but it seems that that source of demand is also drying up as the next chart shows.
Conclusion
Over the long run, market prices are an amazingly efficient allocator of resources, and thus it is very difficult (if not entirely impossible) to extract gains (Alpha) from the marketplace. There will be a time to buy into oil at some point in the future, the data just doesn’t suggest now is that time. Of course, the market could still rise despite the foregoing, but supply/demand imbalances imply that the odds of this occurrence is low. However, it is not impossible – indeed, in markets, nothing is.
