


[The above appeared on the window of a Bookshop, “Bookends of Fowey” in Cornwall].
We don’t often do market commentaries in this blog, but after the biggest January gain for 32 years, it might be useful to look at what drove asset markets to such giddy heights, whereby nearly ALL asset classes went berserk. Once one pores over the fine print regarding performance, some interesting pictures emerge.
The first is the economic backdrop, which does not appear overly helpful. Interest rate markets imply no more rate hikes, as the US economy appears to be slowing substantially, potentially taking the global economy with it.
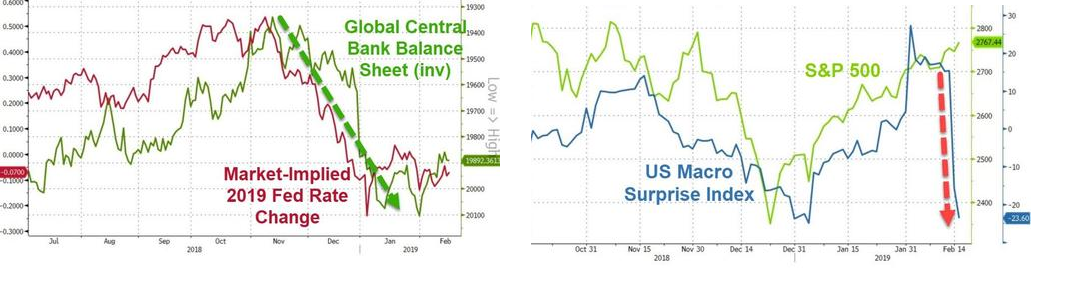
But fundamentals don’t always matter (which is why we don’t pay too much attention to them). Sometimes, following the money is enough and Chinese (state-controlled) banks lent a record 3.23 trillion Yuan, ($477 billion) in January as the authorities appear to be getting increasingly desperate to jump-start the languishing economy [1]. One might have imagined that Chinese equities would be in the vanguard of gains in January, but in fact, Chinese shares (basis the Shanghai Composite Index) were up “only” 3.63% on the month and the Chinese version of Nasdaq (the Chinext Index) was actually down by 1.8%. So the beneficiaries of the monetary largesse were, it seems bullish on equities – just not Chinese ones! Money has “leaked” out of China and into global (US) markets.
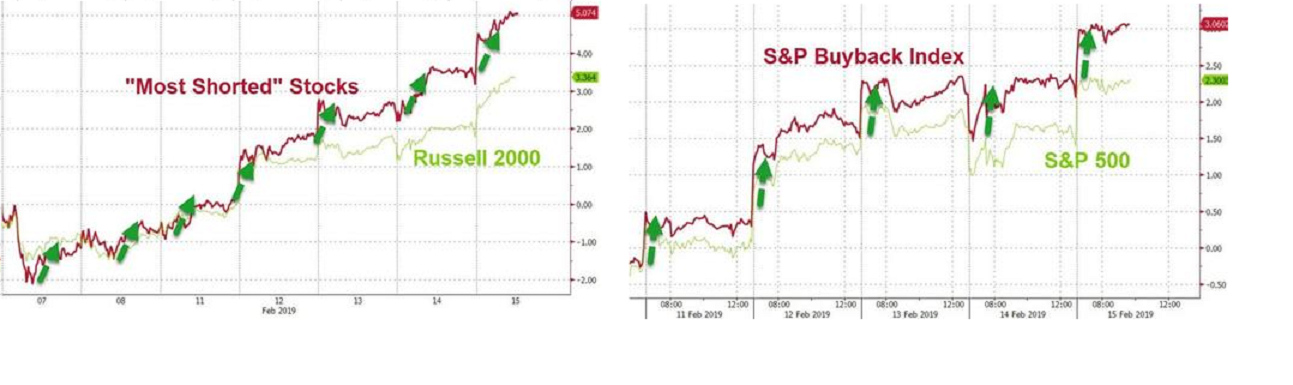
In addition to the China credit infusion, these two charts also explain why markets went north in a hurry. Two other powerful sources of demand for equities were also leaning in the same direction, as shorts were (once again) forced to cover their positions and US Corporations bought back more stock.
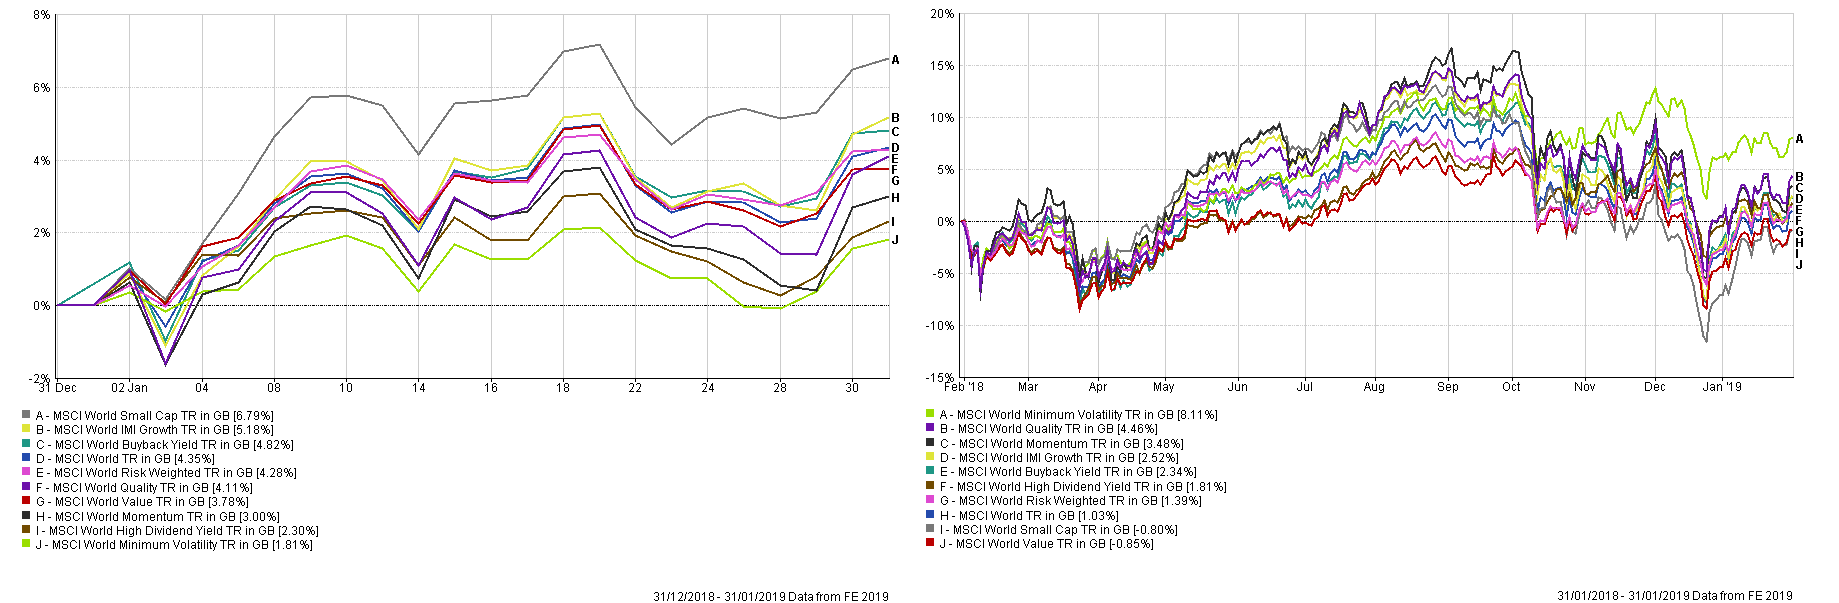
If we look at some of the Factor returns for the month, we can see some sharp reversals in January relative to the year to end January 2019 (see below). Although Growth continued to beat Value over both time frames Globally, it did not do so by as big a margin as one might have imagined (given the extent of the market gains), and in the UK for example, Value beat Growth in January (and nearly did so in Europe ex-UK too). Small Caps went from near the bottom of the table to the top with traditional “defensive” plays, High Dividend Yield and Minimum Volatility and Quality dropped back sharply (in relative terms). Buyback Yield returns reflected the buying back of stock by companies. Under the surface therefore, it was not a wholesale “risk-on” move up, though it might have felt like that.
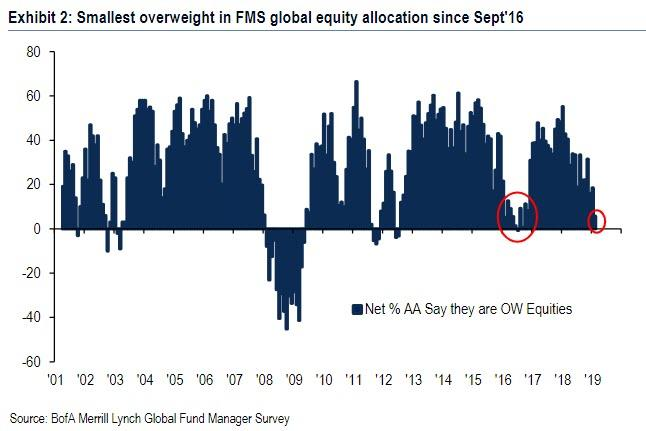
But possibly the biggest surprise is that Fund Managers are not buying the rally (either literally or metaphorically). As of the end of January, (see below), net Global Equity exposure had fallen to just +6%, the lowest since September 2016 and -3% (i.e. underweight) to US shares, the most bearish they have been in nine months. Cash allocation has risen from 6% to 44%, the highest since 2009, suggesting continued and aggressive selling into the rising market. This is a highly unusual development – normally they get more bullish as prices rise, but is a signal of extreme skepticism about the rally. This ends one of two ways; either the markets resume the December slide or professional fund managers are forced to plow back into equities. This is becoming a familiar pattern – the bears take a stand and are then subsequently forced to recant, pushing prices sharply higher as they plow back in. Underperformance inevitably follows, leading to more outflows and another surge in Passive flows. Will they EVER learn?
As usual, we offer no predictions as to what comes next; but it is sometimes useful to know why something may have happened, so as to be prepared for whatever occurs thereafter. Investors have to live with uncertainty, but at least if one knows why powerful surges emerge, one is better able to stay on board the train, even if the long term implications are yet to be revealed. Markets rarely advertise their intentions in real time, and seemingly contradictory events often have a way of working themselves out; sometimes for investors, why things happen is more important to help keep investors focused on the long term than what actually transpired.
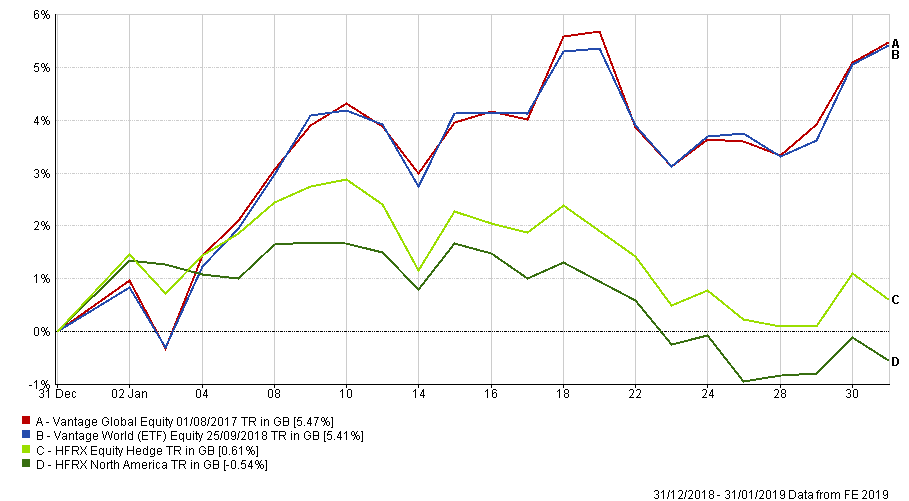
For what it is worth (and one month’s data is not worth much), EBI 100 (Global and World (which has ETF positions)), which are the nearest proxy portfolios we run to the above holdings, both did pretty well in January, rising by 5.47% and 5.41% respectively over the period, reflecting their diversified nature, (which includes exposure to Small Cap shares). This tells us nothing about the future, except that the portfolios appear well able to deal with “extreme” events in both directions. As for Hedge Funds, the situation appears to be going from bad to worse…
[1] To put that enormous number in context, consider that it represents 16% of the total GDP of the UK for 2019. It is also c.5% of China’s GDP – this is not an adjustment, this is a fully-fledged opening of the credit spigot. In fact, once one adds in “Aggregate Financing” the total came to $685 billion, which is more than the GDP of Saudi Arabia…
