


“Nothing is so painful to the human mind as a great and sudden change.” – Mary Shelley.
The last week has seen cracks emerge in the once-impregnable FAANGs stocks. On Thursday last week, Facebook shares fell over 19%, to be followed the next day by those of Twitter, which fell 22% as both firms warned that the number of their users had fallen below both estimates and compared to previous metrics. They also noted that future growth would likely fall leading to a big rush to the exits on the part of investors. Both beat earnings estimates, but this did not deter sellers from running riot. According to Factset, who track earnings estimates in the US, the number of Companies reporting above estimate earnings is at 5-year highs, but investors are far from impressed – we could call this expectations fatigue, but it may also be due to the valuations already “priced in” to some shares [1].
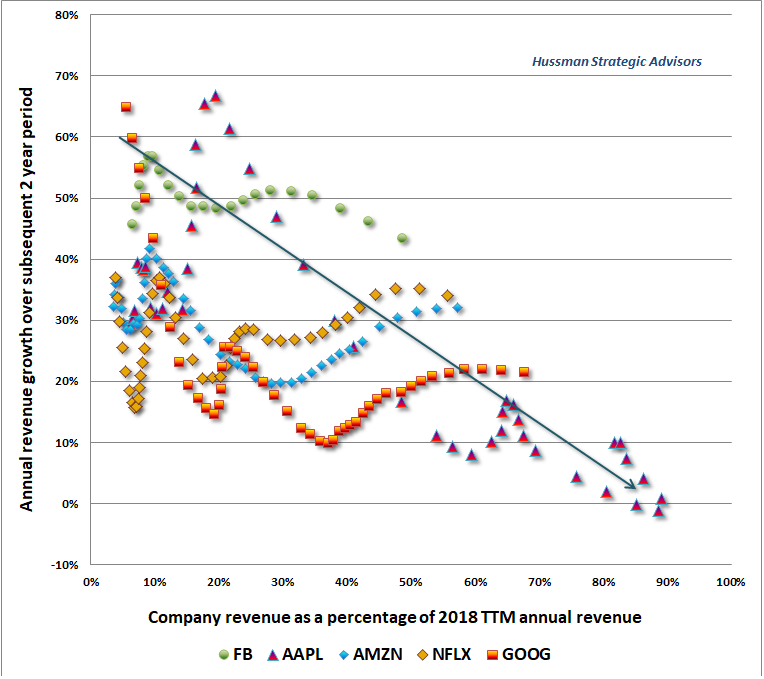
The compound effect of a growing market and an increasing market share sees growth rates initially soar [2]. One can make assumptions for adoption rates for a product, replacement rates, market growth rates etc. but they ALL run up against the same brick wall – once a firm’s market penetration rate rises beyond a critical point, growth rates fall. After stellar growth for most of the last two decades. Apple’s growth rate has now fallen to an average of 7.83% p.a. over the last 3 years, a sign that for them, the process has already begun. If replacement rates fail to improve, the rate of new adoption will have to rise markedly, simply to avoid the dreaded “no-growth” label for the firm. This is no fault of Apple’s, but a feature of the process – it is entirely normal (and predictable).
The process can be seen in the chart below (from Hussman Funds.com). In the long term, one should expect growth rates to fall (gradually) to the level of nominal GDP (allowing for productivity growth, demographic changes and long-term inflation and unemployment rates remaining stable), as that is the average cumulative growth rate of the economy.
Whilst these share price moves may come as a surprise to many, maybe they shouldn’t [3]. There is a tendency (both among Analysts and Investors) to look backward at strong growth rates and assume that this state of affairs will continue indefinitely into the future. Thus, when a “growth” firm becomes a “mature” firm, investors often react in what looks like shock. This is because they fail to take into account the limits of “logistic growth“, whereby (as per our examples above), a company’s growth slows as the size of the market approaches its maximum, falling in proportion to the amount of remaining capacity in the system. Ultimately, once everyone has a Facebook account, or an iPhone, who else is left to join in? It seems that investors do not anticipate this deceleration in growth rates once a previously small company in a growth sector becomes a large operation in a mature one. The seeds of disappointment are thus sown in the preceding popularity of a trend; all economic growth is the result of trends/drivers and the danger is in extrapolating those trends too far into the future.
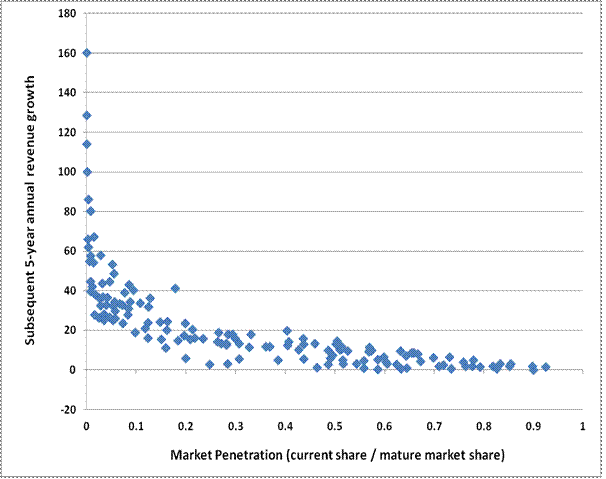
This process may not seem credible, but the chart below shows the market share (and subsequent growth rates) of Microsoft, Cisco, Intel, Oracle, IBM, Dell and Wal-Mart (previous market favourites) over time. All are now seen as more-or-less “mature” companies. It went the same way for them too…
So, (apart from ignoring analysts), the main thing to do is to remember that “this too shall pass”; change is the only constant in markets and what waxes now will wane in time. Which is why we both diversify AND re-balance our portfolio when necessary – they both have the effect of reducing risk, by ensuring that we don’t own too much of anything. In a complex eco-system, one can never be sure of what will happen next, as market prices reflect feedback loops of which we have little or no knowledge and even less warning of their demise; Minsky warned us of the inherent instability of economic systems and this applies at both a macro and micro level. This does not mean a crash is due, merely that volatility (a symptom of market instability) will probably rise as markets adjust to a “new” normal.
EBI 70 (Global) has around 31% exposure to US equities [4], versus 18.1% for the Home Bias (UK) version, compared to the US weighting in the MSCI World Index of 60.7%. Thus, the effect of a major fall in the FAANGs stocks is likely to be limited, (we own other US shares as well), and will be offset to a large extent by rises elsewhere in the portfolio, which is the point of diversification. The gains of recent months in International Stocks mean that we are edging closer to a re-balance too, as International equities have done extremely well in the last year or so (at the expense of the UK, in relative terms at least). Thus, weightings are maintained at (more or less) the level required by the investor; any declines can be anticipated a priori to an extent. This, therefore, reduces the “shock effect” of market falls and makes it easier to live with them, which in turn increases the odds of the investor sticking with the plan. Market declines are inevitable – it is how investors react to them that determines their overall success…
[1] To take one example, Amazon is expected to earn $11.7 billion in 2019. At a market cap of $1 trillion, even if earnings were to be double that ($23.4 billion) the P/E would still be 42.7x, versus 17.65x for the S&P 500 Index (forward earnings basis). IF growth is slowing, is a valuation premium warranted at all?
[2] Imagine a market worth £10 and growing at 30% per annum for a decade. It would be worth (1.3^10 = 13.785 x 10= £137.86). If the market share of that company rises from 10% to 50%, the annual growth rate would be [£10 x (137.86 x 0.1) x 0.5 = 68.93] = 52.7% annualised (68.93/1 ^0.1 = 1.527).
If the (now mature) market doubles over the following decade, whilst market share drops only a little (to 40% say), the resulting 10-year growth is just 4.8% p.a. (110.29/68.93^0.1= 4.81%).
[3] Problems emerge if valuations are stretched; pre the plunge last week, Facebook shares were trading on a (215/5.39) = 39.9x P/E. After a 20% price fall, the P/E is still 31.8x and would need to fall another 25% to reach the S&P 500’s current level of 24x (trailing earnings basis). OR, EPS could grow by 9.8% p.a, over the next 3 years (assuming no share price gains in the interim-a rather tall order).
[4] Clearly the higher the equity content of the portfolio, the higher the US exposure will be; EBI 100 (Global) has a 44.5% weighting.
